Sentinel 1 Surface Soil Moisture (SSM)
Learn how to compute surface soil moisture from Sentinel-1 data

Table of contents
Run this notebook interactively with all dependencies pre-installed
Introduction
In this notebook, we will demonstrate how to compute surface soil moisture (SSM) from Sentinel-1 data using EOPF Zarr data. Surface soil moisture is a crucial parameter for various applications, including agriculture, hydrology, and climate studies.
The original notebook comes from the Copernicus Data Space Ecosystem
Setup
Start importing the necessary libraries
import pystac_client
import xarray as xr
import numpy as np
from scipy.interpolate import griddata
import matplotlib.pyplot as plt

xr.set_options(display_expand_attrs=False)
<xarray.core.options.set_options at 0x7f5d6cdebb60>Configuration
# Bounding box [min_lon, min_lat, max_lon, max_lat]
bbox = [139.400, -35.400, 139.450, -35.350]

# Reference period (for establishing dry and wet conditions)
reference_start = "2017-02-02"
reference_end = "2020-02-02"

# Current period (observation to calculate SSM for)
current_start = "2020-01-02"
current_end = "2020-01-28"

# Spatial resolution for geocoded output (degrees)
spatial_resolution = 0.0001

# STAC catalog
catalog = pystac_client.Client.open("https://stac.core.eopf.eodc.eu")
Helper functions
The following helper functions handle the core SAR data preprocessing: spatial slicing to extract our area of interest, sigma-nought calibration to convert digital numbers to backscatter values, and geocoding to transform from radar geometry to geographic coordinates.
def build_slice(shape, idx, offset=2):
    i0 = int(min(idx[0]))
    i1 = int(max(idx[1]))

    def clamp_slice(i, dim_size):
        start = max(0, i - offset)
        end = min(dim_size - 1, i + offset)
        return slice(start, end + 1)

    return [clamp_slice(i0, shape[0]), clamp_slice(i1, shape[1])]
def create_regular_grid(min_x, max_x, min_y, max_y, spatialres):
width = int(np.ceil((max_x - min_x) / spatialres))
height = int(np.ceil((max_y - min_y) / spatialres))
half_pixel = spatialres / 2.0
x_regular = np.linspace(
min_x + half_pixel, max_x - half_pixel, width, dtype=np.float32
)
y_regular = np.linspace(
min_y + half_pixel, max_y - half_pixel, height, dtype=np.float32
)
grid_x_regular, grid_y_regular = np.meshgrid(x_regular, y_regular)
return grid_x_regular, grid_y_regulardef geocode_grd(sigma_0, grid_x_regular, grid_y_regular):
grid_lat = sigma_0.latitude.values
grid_lon = sigma_0.longitude.values
# Set border values to zero to avoid artifacts
sigma_0["vh"].data[[0, -1], :] = 0
sigma_0["vh"].data[:, [0, -1]] = 0
sigma_0["vv"].data[[0, -1], :] = 0
sigma_0["vv"].data[:, [0, -1]] = 0
interpolated_values_grid_vh = griddata(
(grid_lon.flatten(), grid_lat.flatten()),
sigma_0.vh.values.flatten(),
(grid_x_regular, grid_y_regular),
method="nearest",
)
interpolated_values_grid_vv = griddata(
(grid_lon.flatten(), grid_lat.flatten()),
sigma_0.vv.values.flatten(),
(grid_x_regular, grid_y_regular),
method="nearest",
)
ds = xr.Dataset(
coords=dict(
time=(["time"], [sigma_0.time.values]),
y=(["y"], grid_y_regular[:, 0]),
x=(["x"], grid_x_regular[0, :]),
)
)
ds["vh"] = (("time", "y", "x"), np.expand_dims(interpolated_values_grid_vh, 0))
ds["vv"] = (("time", "y", "x"), np.expand_dims(interpolated_values_grid_vv, 0))
ds = ds.where(ds != 0)
return dsdef preprocess_grd(grd_path, bbox):
# Data Access
dt = xr.open_datatree(grd_path, engine="zarr", chunks="auto")
t = np.datetime64(dt.attrs["stac_discovery"]["properties"]["datetime"][:-2], "ns")
group_VH = [x for x in dt.children if "VH" in x][0]
grd = dt[group_VH].measurements.to_dataset().rename({"grd": "vh"})
group_VV = [x for x in dt.children if "VV" in x][0]
grd["vv"] = dt[group_VV].measurements.to_dataset().grd
# Spatial Slicing
gcps = dt[group_VH].conditions.gcp.to_dataset()[["latitude", "longitude"]]
mask = (
(gcps.latitude < bbox[3])
& (gcps.latitude > bbox[1])
& (gcps.longitude < bbox[2])
& (gcps.longitude > bbox[0])
)
idx = np.where(mask == 1)
if len(idx[0]) == 0 or len(idx[1]) == 0:
return None
azimuth_time_slice, ground_range_slice = build_slice(mask.shape, idx)
gcps_crop = gcps.isel(
dict(azimuth_time=azimuth_time_slice, ground_range=ground_range_slice)
)
azimuth_time_min = gcps_crop.azimuth_time.min().values
azimuth_time_max = gcps_crop.azimuth_time.max().values
ground_range_min = gcps_crop.ground_range.min().values
ground_range_max = gcps_crop.ground_range.max().values
grd_crop = grd.sel(
dict(
azimuth_time=slice(azimuth_time_min, azimuth_time_max),
ground_range=slice(ground_range_min, ground_range_max),
)
)
gcps_crop_interp = gcps_crop.interp_like(grd_crop)
grd_crop = grd_crop.assign_coords(
{"latitude": gcps_crop_interp.latitude, "longitude": gcps_crop_interp.longitude}
)
mask_2 = (
(gcps_crop_interp.latitude < bbox[3])
& (gcps_crop_interp.latitude > bbox[1])
& (gcps_crop_interp.longitude < bbox[2])
& (gcps_crop_interp.longitude > bbox[0])
)
grd_crop = grd_crop.where(mask_2.compute(), drop=True)
# Calibration
sigma_lut = dt[group_VH].quality.calibration.sigma_nought
sigma_lut_line_pixel = xr.DataArray(
data=sigma_lut.data,
dims=["line", "pixel"],
coords=dict(
line=(["line"], sigma_lut.line.values),
pixel=(["pixel"], sigma_lut.pixel.values),
),
)
grd_line_pixel = xr.DataArray(
data=grd_crop.vh.data,
dims=["line", "pixel"],
coords=dict(
line=(["line"], grd_crop.vh.line.values),
pixel=(["pixel"], grd_crop.vh.pixel.values),
),
)
sigma_lut_interp_line_pixel = sigma_lut_line_pixel.interp_like(
grd_line_pixel, method="linear"
)
sigma_lut_interp = xr.DataArray(
data=sigma_lut_interp_line_pixel.data,
dims=["azimuth_time", "ground_range"],
coords=dict(
azimuth_time=(["azimuth_time"], grd_crop.azimuth_time.values),
ground_range=(["ground_range"], grd_crop.ground_range.values),
),
)
sigma_0 = (abs(grd_crop.astype(np.float32)) ** 2) / (sigma_lut_interp**2)
sigma_0 = sigma_0.assign_coords(time=t)
sigma_0 = sigma_0.compute()
return [
sigma_0,
(
np.min(sigma_0.latitude.values).item(),
np.max(sigma_0.latitude.values).item(),
),
(
np.min(sigma_0.longitude.values).item(),
np.max(sigma_0.longitude.values).item(),
),
]Creating a reference period datacube
ref_items = list(
    catalog.search(
        collections=["sentinel-1-l1-grd"],
        bbox=bbox,
        datetime=[reference_start, reference_end],
    ).items()
)
print(f"Found {len(ref_items)} reference images")

grd_paths_ref = [p.assets["product"].href for p in ref_items]
Found 91 reference images
Preprocess reference period data
%%time

from concurrent.futures import ThreadPoolExecutor, as_completed

grd_products = []
max_workers = 2

with ThreadPoolExecutor(max_workers=max_workers) as executor:
    future_to_path = {
        executor.submit(preprocess_grd, grd_path, bbox): grd_path
        for grd_path in grd_paths_ref
    }

    for i, future in enumerate(as_completed(future_to_path), 1):
        try:
            result = future.result()
            if result is not None:
                grd_products.append(result)
        except Exception:
            grd_path = future_to_path[future]

print(f"\nSuccessfully preprocessed {len(grd_products)} images")
Successfully preprocessed 91 images
CPU times: user 2min 5s, sys: 1min 9s, total: 3min 14s
Wall time: 1min 24s
Geocode reference period data
min_lat = np.min([i[1][0] for i in grd_products])
max_lat = np.max([i[1][1] for i in grd_products])
min_lon = np.min([i[2][0] for i in grd_products])
max_lon = np.max([i[2][1] for i in grd_products])

grid_x_regular, grid_y_regular = create_regular_grid(
    min_lon, max_lon, min_lat, max_lat, spatial_resolution
)

print(f"Grid shape: {grid_y_regular.shape}")
Grid shape: (723, 823)
%%time
from concurrent.futures import ThreadPoolExecutor, as_completed
import gc

grd_products_geocoded = []

with ThreadPoolExecutor(max_workers=2) as executor:
    futures = [
        executor.submit(geocode_grd, grd_product[0], grid_x_regular, grid_y_regular)
        for grd_product in grd_products
    ]

    for i, future in enumerate(as_completed(futures), 1):
        result = future.result()
        grd_products_geocoded.append(result)

        if i % 10 == 0:
            gc.collect()

print(f"\nGeocoded {len(grd_products_geocoded)} products")

sigma_0_ref_series = xr.concat(grd_products_geocoded, dim="time").sortby("time")
sigma_0_ref_series = (
    sigma_0_ref_series.groupby("time.date").max("time").rename(dict(date="time"))
)
sigma_0_ref_series = sigma_0_ref_series.where(~np.isnan(sigma_0_ref_series), drop=True)

sigma_0_ref_series
Geocoded 91 products
CPU times: user 3min, sys: 743 ms, total: 3min
Wall time: 1min 31s
Calculate dry and wet references
# Dry reference = minimum backscatter (driest conditions)
dry_ref = sigma_0_ref_series.min(dim="time")

# Wet reference = maximum backscatter (wettest conditions)
wet_ref = sigma_0_ref_series.max(dim="time")
Search current period data
cur_items = list(
    catalog.search(
        collections=["sentinel-1-l1-grd"],
        bbox=bbox,
        datetime=[current_start, current_end],
    ).items()
)

grd_path_current = [p.assets["product"].href for p in cur_items][-1]
Process current observations
%%time

grd_product_current = preprocess_grd(grd_path_current, bbox)

sigma_0_current = geocode_grd(grd_product_current[0], grid_x_regular, grid_y_regular)

sigma_0_current = sigma_0_current.isel(time=0)
sigma_0_current
CPU times: user 3.3 s, sys: 756 ms, total: 4.06 s
Wall time: 5.69 s
Calculate surface soil moisture
# SSM = (current - dry) / (wet - dry)
SSM_vv = (sigma_0_current.vv - dry_ref.vv) / (wet_ref.vv - dry_ref.vv)
SSM_vh = (sigma_0_current.vh - dry_ref.vh) / (wet_ref.vh - dry_ref.vh)

# Clip to [0, 1] range
SSM_vv = SSM_vv.clip(0, 1)
SSM_vh = SSM_vh.clip(0, 1)
Visualize results
average_ref = sigma_0_ref_series.mean(dim="time")

average_ref_db = 10 * np.log10(average_ref)
# Convert current observation to dB for consistent visualization
sigma_0_current_db = 10 * np.log10(sigma_0_current)
fig, axes = plt.subplots(1, 3, figsize=(18, 6), sharex=True, sharey=True)
# Current observation in dB (higher = brighter/more reflection)
sigma_0_current_db.vv.plot.imshow(
ax=axes[0], vmin=-25, vmax=-12, cmap="viridis", add_colorbar=True
)
axes[0].set_title(
"Current Backscatter VV (dB)\nBrighter = stronger radar return", fontsize=12
)
# Average reference in dB (used for masking)
average_ref_db.vv.plot.imshow(
ax=axes[1], vmin=-25, vmax=-12, cmap="viridis", add_colorbar=True
)
axes[1].set_title("Average Reference VV (dB)", fontsize=12)
# Surface Soil Moisture (0 = dry, 0.6 = wet)
SSM_vv.plot.imshow(ax=axes[2], vmin=0, vmax=0.6, cmap="viridis", add_colorbar=True)
axes[2].set_title(
"Surface Soil Moisture VV\nBrighter = wetter conditions (0=dry, 0.6=wet)",
fontsize=12,
)
plt.tight_layout()
plt.show()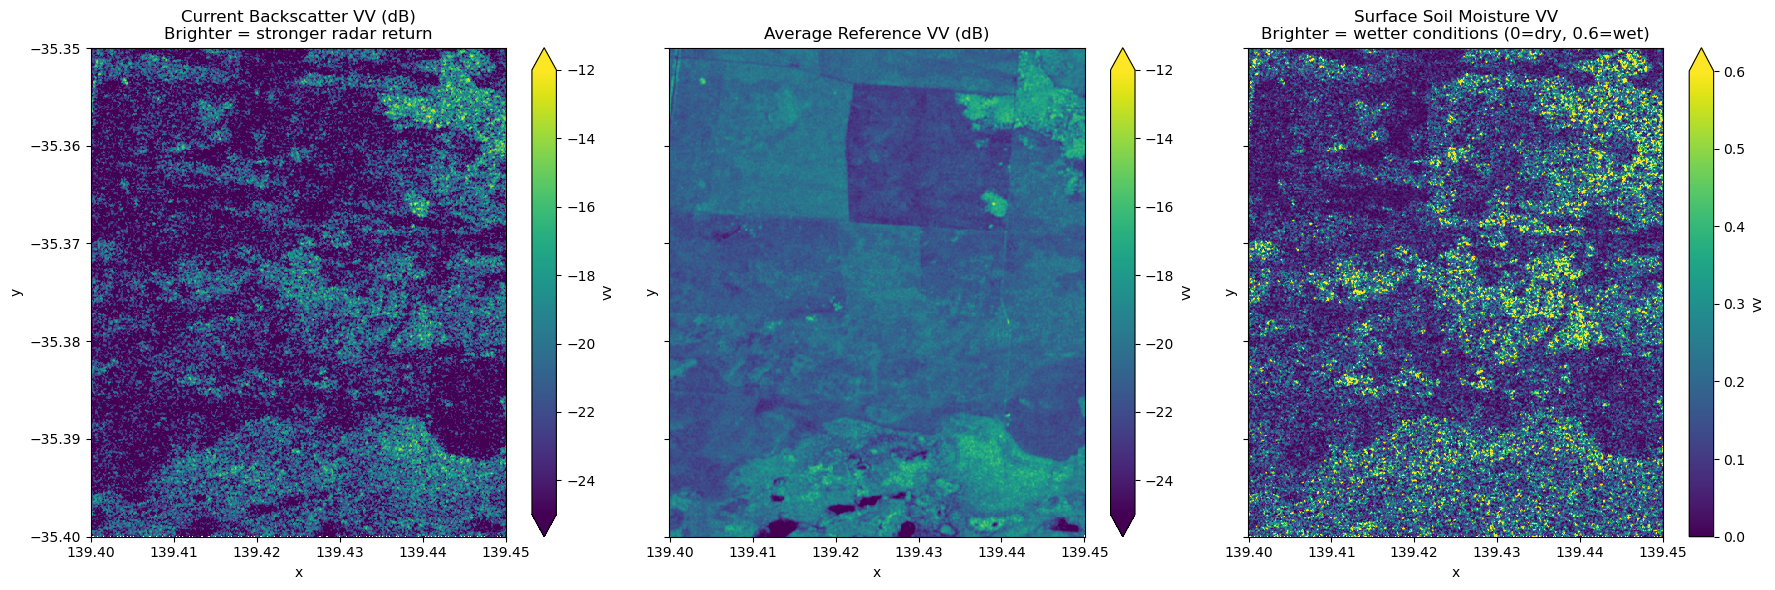
Understanding the visualization
Current Backscatter (dB): Radar signal intensity from the current observation date. Higher values (brighter/yellow) indicate stronger returns from rough surfaces, buildings, or wet soil. Lower values (darker/blue) indicate smooth surfaces like water bodies or very dry bare soil.
Average Reference (dB): Mean backscatter computed across all reference period acquisitions. This temporal average smooths out short-term variations and reveals persistent features like water bodies (consistently low backscatter) and urban areas (consistently high backscatter), which can be used for masking.
Surface Soil Moisture (SSM): Normalized values from 0 (dry) to 0.6 (wet) representing the relative moisture content of the top soil layer:
0.0 - 0.2 (dark blue): Very dry soil conditions
0.2 - 0.4 (blue-green): Moderately dry soil
0.4 - 0.6 (green-yellow): Moist to wet soil
SSM is calculated by normalizing the current backscatter between the driest (minimum) and wettest (maximum) conditions observed during the reference period.
