Regridding Sentinel-3 SLSTR Data
Learn how to regridding Sentinel-3 SLSTR data

Table of contents
Run this notebook interactively with all dependencies pre-installed
1. Introduction
We’ll take a Sentinel-3 dataset — specifically, the Sea and Land Surface Temperature Radiometer (SLSTR) Level-2 Land Surface Temperature (LST) product — and show how regridding transforms it from its original irregular grid to a uniform grid. This will help illustrate why regridding is useful and what changes it introduces.
What is Regridding?
Regridding is the process of converting spatial data from its original grid (e.g., the irregular swath pattern of a satellite) to a regular grid with consistent spatial resolution. This makes the data easier to analyze, visualize, and integrate with other datasets.
import xarray as xr
import matplotlib.pyplot as plt
import cartopy.crs as ccrs
import cartopy.feature as cfeature
import numpy as np
from scipy.interpolate import griddata# Replace with your actual file path
file_path = "https://objects.eodc.eu/e05ab01a9d56408d82ac32d69a5aae2a:sample-data/tutorial_data/cpm_v253/S3A_SL_2_LST____20230601T093633_20230601T093933_20230602T185038_0179_099_250_1980_PS1_O_NT_004.zarr"
dt = xr.open_datatree(file_path, engine="zarr", consolidated=True)
measurements_ds = dt["measurements"].ds
# Extract variables
lst_original = measurements_ds["lst"] # Land Surface Temperature
lat_original = measurements_ds["latitude"]
lon_original = measurements_ds["longitude"]Verify Data Extent
lat_min, lat_max = lat_original.min().item(), lat_original.max().item()
lon_min, lon_max = lon_original.min().item(), lon_original.max().item()
lat_min, lat_max, lon_min, lon_max
(49.378370999999994, 62.922801, 1.648556, 30.086996)Regridding
Define Target Grid
target_resolution = 0.02

# Compute number of points based on extent and resolution for full extent
n_points_lat_full = int(np.ceil((lat_max - lat_min) / target_resolution)) + 1
n_points_lon_full = int(np.ceil((lon_max - lon_min) / target_resolution)) + 1
target_lat_full = np.linspace(lat_min, lat_max, n_points_lat_full)
target_lon_full = np.linspace(lon_min, lon_max, n_points_lon_full)
lon_grid_full, lat_grid_full = np.meshgrid(target_lon_full, target_lat_full)
Apply Regridding with GridData
lst_regridded_full = griddata(
    (lon_original.values.flatten(), lat_original.values.flatten()),
    lst_original.values.flatten(),
    (lon_grid_full, lat_grid_full),
    method="linear",
)
print("Regridding completed.")
print(
    f"Regridded LST (Full Extent) shape: {lst_regridded_full.shape} (lat points: {n_points_lat_full}, lon points: {n_points_lon_full})"
)
Regridding completed.
Regridded LST (Full Extent) shape: (679, 1423) (lat points: 679, lon points: 1423)
Visualization
Plot Regridded Data
fig, ax = plt.subplots(figsize=(10, 8), subplot_kw={"projection": ccrs.PlateCarree()})
mappable = ax.pcolormesh(lon_grid_full, lat_grid_full, lst_regridded_full, cmap="hot")
ax.coastlines()
ax.add_feature(cfeature.BORDERS)
ax.set_title("Regridded Sentinel-3 SLSTR LST Data (Full Extent)")
ax.set_xlabel("Longitude (°E)")
ax.set_ylabel("Latitude (°N)")
plt.colorbar(mappable, ax=ax, label="LST (K)")
ax.gridlines(draw_labels=True, color="gray", linestyle="--")
ax.set_xlim(lon_min, lon_max)
ax.set_ylim(lat_min, lat_max)
plt.show()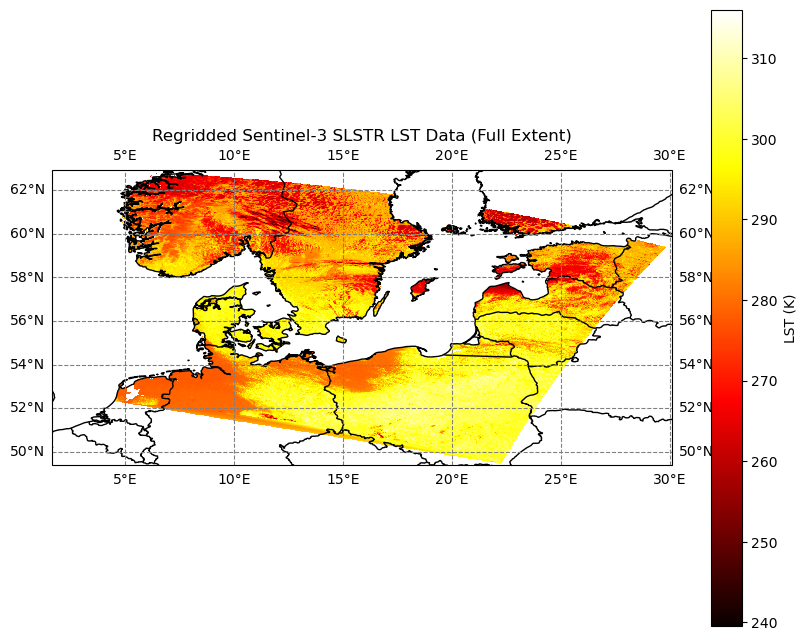
Plot Original Data
fig, ax = plt.subplots(figsize=(10, 8), subplot_kw={"projection": ccrs.PlateCarree()})
scatter = ax.scatter(lon_original, lat_original, c=lst_original, cmap="hot", s=1)
ax.coastlines()
ax.add_feature(cfeature.BORDERS)
ax.set_title("Original Sentinel-3 SLSTR LST Data (Full Extent)")
ax.set_xlabel("Longitude (°E)")
ax.set_ylabel("Latitude (°N)")
plt.colorbar(scatter, ax=ax, label="LST (K)")
ax.gridlines(draw_labels=True, color="gray", linestyle="--")
ax.set_xlim(lon_min, lon_max)
ax.set_ylim(lat_min, lat_max)
plt.show()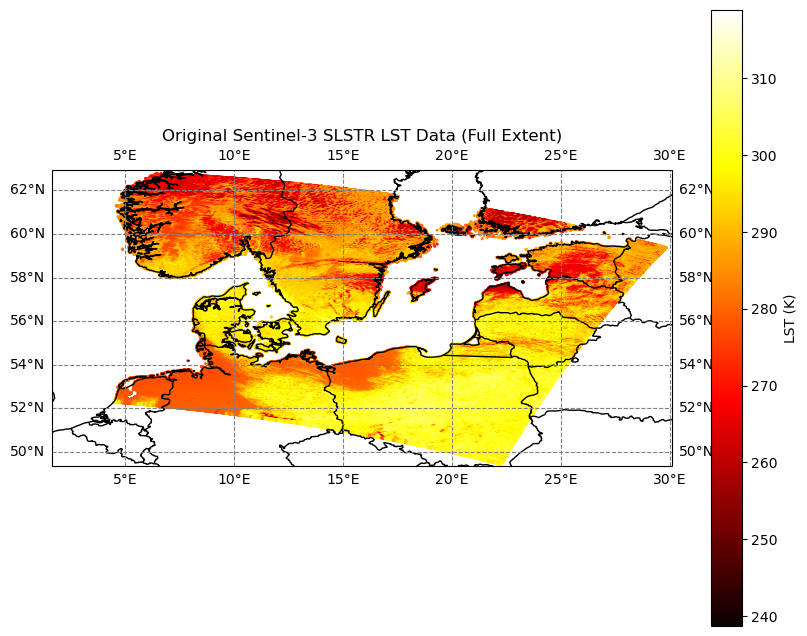
Define Netherlands-specific grid (approx. 50.75–53.5°N, 3.2–7.2°E)
# Define Netherlands subset (50.75–53.5°N, 3.2–7.2°E)
mask_nl = (
    (lat_original >= 50.75)
    & (lat_original <= 53.5)
    & (lon_original >= 3.2)
    & (lon_original <= 7.2)
)
lst_original_nl = lst_original.where(mask_nl, drop=True)
lat_original_nl = lat_original.where(mask_nl, drop=True)
lon_original_nl = lon_original.where(mask_nl, drop=True)
# Compute number of points for Netherlands
lat_min_nl, lat_max_nl = 50.75, 53.5
lon_min_nl, lon_max_nl = 3.2, 7.2
n_points_lat_nl = int(np.ceil((lat_max_nl - lat_min_nl) / target_resolution)) + 1
n_points_lon_nl = int(np.ceil((lon_max_nl - lon_min_nl) / target_resolution)) + 1
target_lat_nl = np.linspace(lat_min_nl, lat_max_nl, n_points_lat_nl)
target_lon_nl = np.linspace(lon_min_nl, lon_max_nl, n_points_lon_nl)
lon_grid_nl, lat_grid_nl = np.meshgrid(target_lon_nl, target_lat_nl)Regrid for Netherlands Grid
lst_regridded_nl = griddata(
    (lon_original.values.flatten(), lat_original.values.flatten()),
    lst_original.values.flatten(),
    (lon_grid_nl, lat_grid_nl),
    method="linear",
)
print("Regridding completed.")
print(
f"Regridded LST (Full Extent) shape: {lst_regridded_full.shape} (lat points: {n_points_lat_full}, lon points: {n_points_lon_full})"
)
print(
f"Regridded LST (Netherlands) shape: {lst_regridded_nl.shape} (lat points: {n_points_lat_nl}, lon points: {n_points_lon_nl})"
)
# 4.3 Display Statistics
# Statistics for original Netherlands data
if lst_original_nl is not None and not lst_original_nl.isnull().all():
mean_orig_nl = lst_original_nl.mean().item()
std_orig_nl = lst_original_nl.std().item()
else:
mean_orig_nl = float("nan")
std_orig_nl = float("nan")
print("Warning: No valid data in original Netherlands subset.")
# Statistics for regridded Netherlands data
if lst_regridded_nl is not None and not np.isnan(lst_regridded_nl).all():
mean_regridded_nl = np.nanmean(lst_regridded_nl)
std_regridded_nl = np.nanstd(lst_regridded_nl)
else:
mean_regridded_nl = float("nan")
std_regridded_nl = float("nan")
print("Warning: No valid data in regridded Netherlands data.")Regridding completed.
Regridded LST (Full Extent) shape: (679, 1423) (lat points: 679, lon points: 1423)
Regridded LST (Netherlands) shape: (139, 201) (lat points: 139, lon points: 201)
Visualization (Netherlands Side-by-Side)
fig, (ax1, ax2) = plt.subplots(
    1, 2, figsize=(16, 6), subplot_kw={"projection": ccrs.PlateCarree()}
)

# 5.2.1 Plot Regridded Data (Netherlands)
mappable1 = ax1.pcolormesh(lon_grid_nl, lat_grid_nl, lst_regridded_nl, cmap="hot")
ax1.coastlines()
ax1.add_feature(cfeature.BORDERS)
ax1.set_title("Regridded Sentinel-3 SLSTR LST Data (Netherlands)")
ax1.set_xlabel("Longitude (°E)")
ax1.set_ylabel("Latitude (°N)")
plt.colorbar(mappable1, ax=ax1, label="LST (K)")
ax1.gridlines(draw_labels=True, color="gray", linestyle="--")
ax1.set_xlim(lon_min_nl, lon_max_nl)
ax1.set_ylim(lat_min_nl, lat_max_nl)

# 5.2.2 Plot Original Data (Netherlands)
scatter2 = ax2.scatter(
    lon_original_nl, lat_original_nl, c=lst_original_nl, cmap="hot", s=1
)
ax2.coastlines()
ax2.add_feature(cfeature.BORDERS)
ax2.set_title("Original Sentinel-3 SLSTR LST Data (Netherlands)")
ax2.set_xlabel("Longitude (°E)")
ax2.set_ylabel("Latitude (°N)")
plt.colorbar(scatter2, ax=ax2, label="LST (K)")
ax2.gridlines(draw_labels=True, color="gray", linestyle="--")
ax2.set_xlim(lon_min_nl, lon_max_nl)
ax2.set_ylim(lat_min_nl, lat_max_nl)

plt.tight_layout()
plt.show()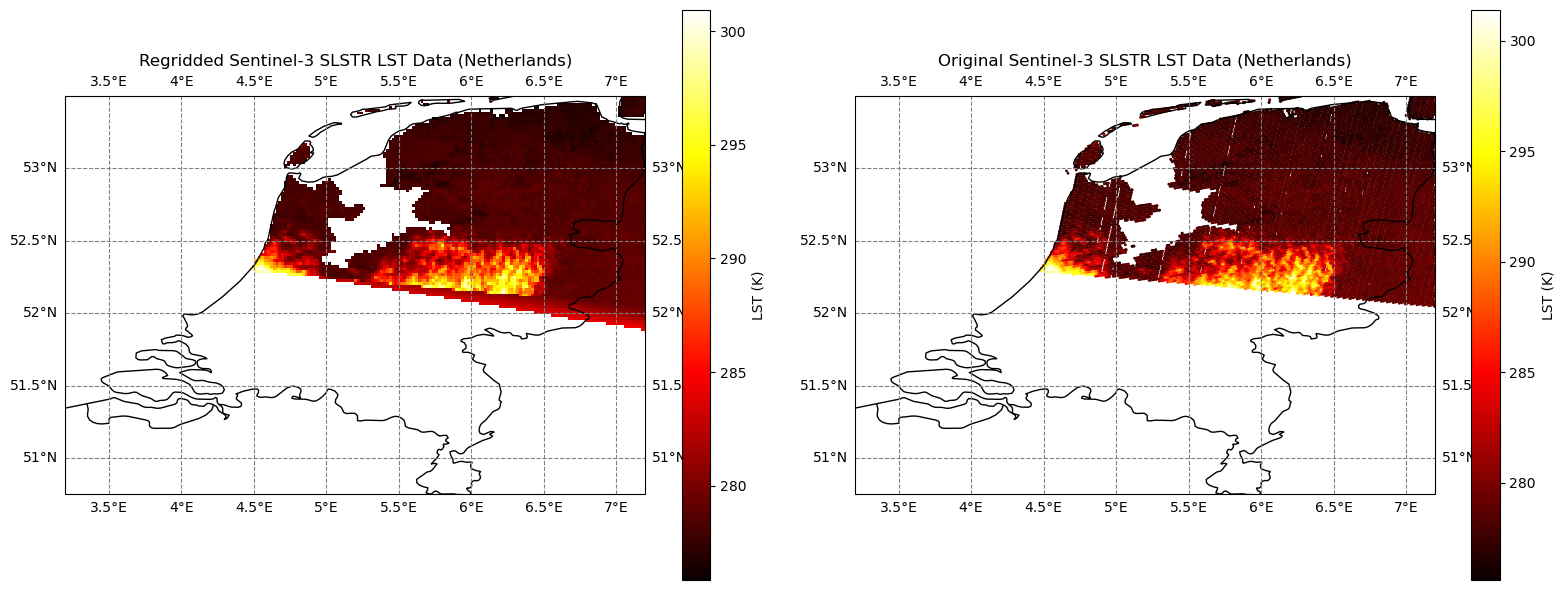
if lst_original_nl is not None and not lst_original_nl.isnull().all():
    mean_orig_nl = lst_original_nl.mean().item()
    std_orig_nl = lst_original_nl.std().item()
else:
    mean_orig_nl = float("nan")
    std_orig_nl = float("nan")
    print("Warning: No valid data in original Netherlands subset.")

# Statistics for regridded Netherlands data
if lst_regridded_nl is not None and not np.isnan(lst_regridded_nl).all():
    mean_regridded_nl = np.nanmean(lst_regridded_nl)
    std_regridded_nl = np.nanstd(lst_regridded_nl)
else:
    mean_regridded_nl = float("nan")
    std_regridded_nl = float("nan")
    print("Warning: No valid data in regridded Netherlands data.")

print("\nNetherlands LST Statistics:")
print(f"Original Mean: {mean_orig_nl:.2f} K")
print(f"Original Std Dev: {std_orig_nl:.2f} K")
print(f"Regridded Mean: {mean_regridded_nl:.2f} K")
print(f"Regridded Std Dev: {std_regridded_nl:.2f} K")
print(f"Mean Difference: {(mean_regridded_nl - mean_orig_nl):.2f} K")
print(f"Std Dev Difference: {(std_regridded_nl - std_orig_nl):.2f} K")
Netherlands LST Statistics:
Original Mean: 279.78 K
Original Std Dev: 3.90 K
Regridded Mean: 280.01 K
Regridded Std Dev: 3.85 K
Mean Difference: 0.24 K
Std Dev Difference: -0.05 K
Statistics for original and regridded full data
if lst_original is not None and not lst_original.isnull().all():
    mean_orig = lst_original.mean().item()
    std_orig = lst_original.std().item()
else:
    mean_orig = float("nan")
    std_orig = float("nan")
    print("Warning: No valid data in original subset.")

# Statistics for regridded  data
if lst_regridded_full is not None and not np.isnan(lst_regridded_full).all():
    mean_regridded = np.nanmean(lst_regridded_full)
    std_regridded = np.nanstd(lst_regridded_full)
else:
    mean_regridded = float("nan")
    std_regridded = float("nan")
    print("Warning: No valid data in regridded  data.")

print("Full area LST Statistics:")
print(f"Original Mean: {mean_orig:.2f} K")
print(f"Original Std Dev: {std_orig:.2f} K")
print(f"Regridded Mean: {mean_regridded:.2f} K")
print(f"Regridded Std Dev: {std_regridded:.2f} K")
print(f"Mean Difference: {(mean_regridded - mean_orig):.2f} K")
print(f"Std Dev Difference: {(std_regridded - std_orig):.2f} K")
Full area LST Statistics:
Original Mean: 288.87 K
Original Std Dev: 11.77 K
Regridded Mean: 288.46 K
Regridded Std Dev: 11.65 K
Mean Difference: -0.41 K
Std Dev Difference: -0.13 K
